As I expected in the last few posts, Bitcoin Price (BTCUSDT) seems to have started a major correction.
Please be with me.
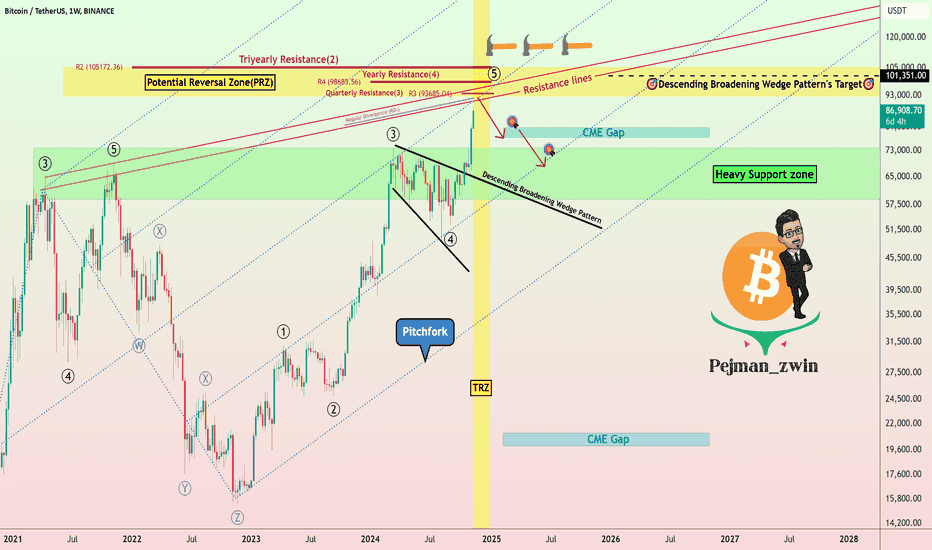
First, let’s take a look at the weekly Bitcoin price action chart analysis that I shared with you on November 12, 2024, which almost gave you an All-Time High(ATH) in both time and price.
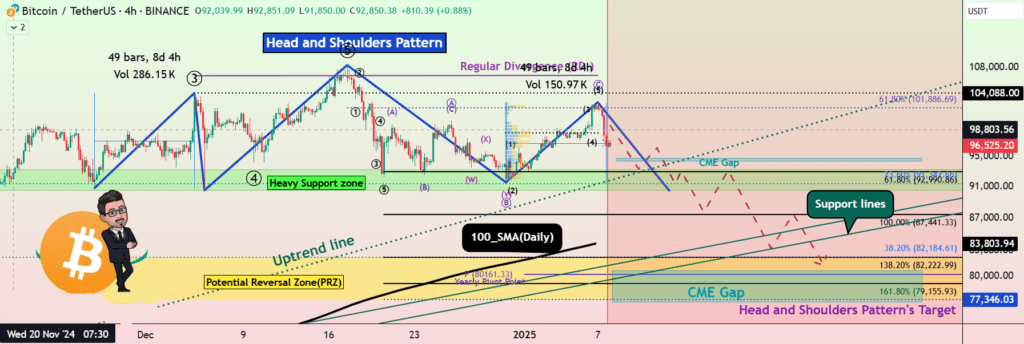
Let’s examine the Bitcoin Price chart on the 4-hour time frame in terms of Classic Technical Analysis. Bitcoin seems to be forming the right shoulder of the Head and Shoulders Pattern. So that in terms of the validity of this pattern, the following two points can be pointed out:
1-During the time when the right shoulder reached the Bitcoin Price $104,000, it was 8 days and 4 hours that the right shoulder was not able to reach $104,000 during this period, and this shows the weakness of buyers or the strength of sellers along the path of the right shoulder.
2-Regular Divergence(RD-) between the right and left shoulders between the price and the volume indicator.
In terms of Elliott wave theory, Bitcoin, over the past 18 days, seems to be forming an Expanding Flat(ABC/3-3-5) corrective pattern, with the main wave C ending at $102,725.
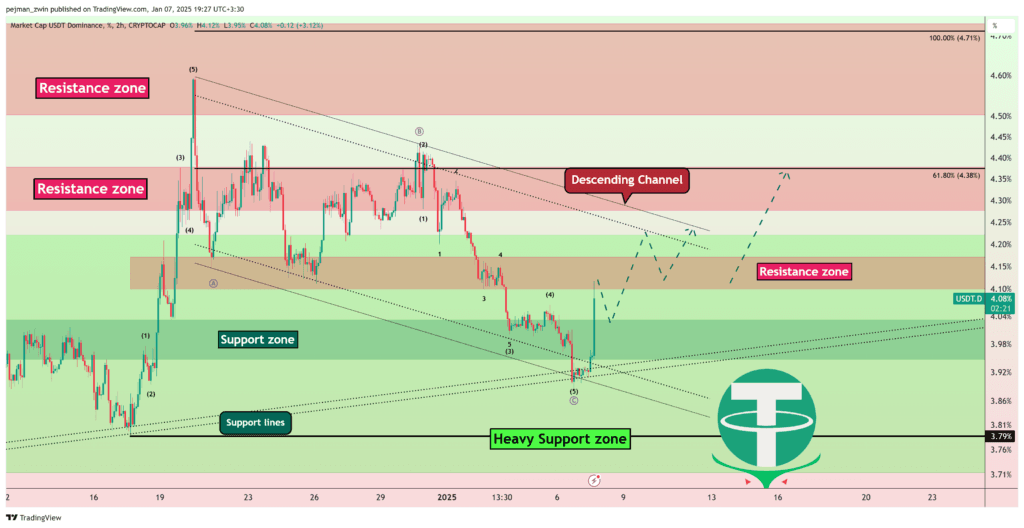
If we look at the chart of USDT.D% (USDT.D), as I said in the update of yesterday’s post, we should have waited for the increase of USDT.D% (due to the sensitive position it was in). I expect USDT.D% to attack the upper line of the descending channel soon.
I expect Bitcoin to attack the Heavy Support zone($93,400-$90,000) and the neckline of the Head and Shoulders Pattern soon, and if it breaks, we should expect Bitcoin to drop to the Potential Reversal Zone(PRZ)[$82,200-$77,300], Support lines and 100_SMA(Daily) and then Bitcoin can fill the CME Gap($80,670-$77,100).
🙏Please respect each other’s ideas and express them politely if you agree or disagree.🙏
Bitcoin price Analyze (BTCUSDT), 4-hour time frame⏰.
🔔Be sure to follow the updated ideas.🔔
Do not forget to put Stop loss for your positions (For every position you want to open).
Please follow your strategy and updates; this is just my Idea, and I will gladly see your ideas in this post.
The Bitcoin Price Chart Analysis by Fadel Qasim. Get our Indicator’s License here..

