🔍 Market Overview
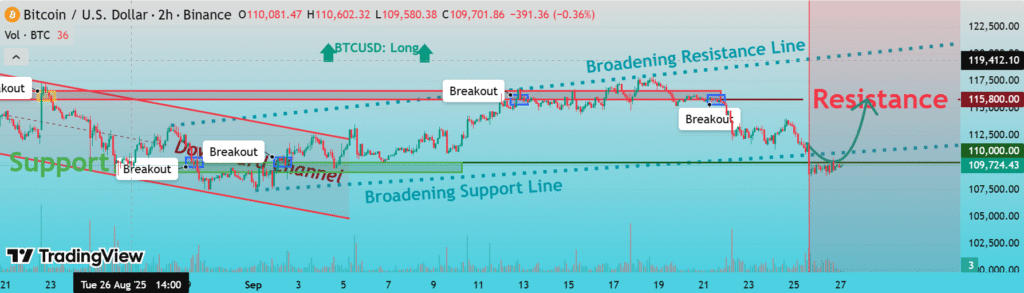
The uploaded 2-hour Bitcoin (BTC/USD) Technical Analysis chart presents a compelling technical setup. Bitcoin is currently trading within a broadening channel pattern, characterized by higher volatility and wider price swings as it progresses. This pattern often reflects a market in a state of uncertainty—frequently followed by a sharp breakout move.
As of September 27, 2025, Bitcoin appears to be holding near a key support zone, and based on the historical price action and breakout history, there’s a bullish scenario forming on the horizon.
🧩 Key Technical Highlights
- Broadening Pattern: The price is moving between a rising broadening support line and a matching broadening resistance line, signaling increasing volatility.
- Support Zone: Strong buyer interest around $109,000–$110,000, where BTC has consistently bounced back in recent weeks.
- Resistance Zone: A significant resistance level has been marked at $115,800, which aligns with previous breakout rejection zones.
- Breakout Signals: Multiple breakout events are identified on the chart, suggesting BTC is trying to gain upward momentum within the broadening structure.
- Bullish Price Projection: The curved arrow suggests a potential upward movement from the current support zone to retest the $115,800 resistance in the coming days.
🔮 Bitcoin Price Prediction: What’s Next?
If Bitcoin (BTC/USD) Technical Analysis can sustain above the $109,000–$110,000 level and volume begins to rise, we could see a breakout toward $115,800. A successful break above that resistance could target the next major level at $119,400, aligned with the upper boundary of the broadening pattern.
However, failure to hold support may invalidate the bullish thesis, potentially sending the price lower toward the $107,500 region.
Bitcoin price prediction 2025, Crypto breakout pattern, Bitcoin (BTC/USD) Technical Analysis, Bitcoin investment strategy, Bitcoin support and resistance levels, Bitcoin trading signals, Cryptocurrency market analysis

