Best Forex Trading Strategies
The following forex trading strategies are utilised by traders to provide structure to their trading efforts. These strategies are not specifically designed for forex markets but are rather general strategies that can be applied to all financial markets. The strategy you decide on will correlate to the type of trader you are. Open an account to start practising your forex trading strategies via spread bets and CFDs.
1. Bounce strategy
Many forex traders believe levels that were important in the past could be important in the future. This follows the logic that if a market dropped to a specific level and then ‘bounced’ back, the market viewed this support level as a good place to buy. So, if the forex pair slips back to that level again it could, therefore, signify a potential trading opportunity.

2. Running out of steam strategy
Similar to analysing support levels, forex traders also analyse resistance levels. The resistance level is a point where the market turned from its previous peak and headed back down. If a market is appreciating but then suddenly falls, the overall view is likely to be that the price is getting too expensive. This forex trading strategy mirrors the bounce strategy. We are looking for the forex pair to ‘run out of steam’ near that previous high and then go short and sell to try and profit from a slide in price.
Such strategies, based on previous highs and lows on a chart, can make risk management relatively straightforward for any trader. For instance, if we are looking for a bounce off a level, our stop loss can go below that previous low point. If we are looking to sell short when a market starts to falter near a previous high, then many traders will place a stop loss above that previous high.
The forex strategy example below shows how a high from the previous day in the AUD/USD currency pair ended up being the place where the market twice ran out of steam the following morning.

3. Breakout strategy
Resistance and support levels are dynamic and are prone to price breakouts in either direction. If the price exceeds important support or resistant levels it is likely to breakout. Many traders could view this as a potentially important change in market sentiment.
Previously when the forex pair was up at that high, the sellers moved in and the price fell, suggesting the market had reached an overvalued level. If that old high is breached, also known as breaking resistance, then something has clearly changed. Traders are now happy to keep on buying where previously they thought the price was too expensive.
This can be an effective forex trading strategy for catching new trends. Every journey starts with a single step. When direction in the markets changes then the breakout trading strategy is often one of the early signals. The example shown is for EUR/USD – a longer-term breakout on the daily charts.

4. Breakdown strategy
Similar in function, but in the opposite direction to the breakout strategy is the breakdown strategy. This forex trading strategy is designed to jump aboard a move when a forex market slips below a previous support level. Once again, many traders could view this as a change in sentiment towards the market. Suddenly a level where buyers were happy to buy as they viewed the market as cheap and expected it to rise – has been broken. This breakthrough of what is known as a support level can be viewed as an opportunity to short sell and try to profit from further weakness in price.
The example shows USD/JPY on an hourly chart. It is an important example as it demonstrates that, in the real world, even the best forex trading strategies do not work all the time. There is a false signal (highlighted by the circle) before the effective signal (highlighted by the black arrows) that saw the market really start to fall.

💥 Contact us, to get Indicator’s License:
👉 Skype: @fadelqasim
👉 Telegram: https://t.me/fadelqasim
👉 Email: support@qasimproindicators.com
5. Overbought and oversold
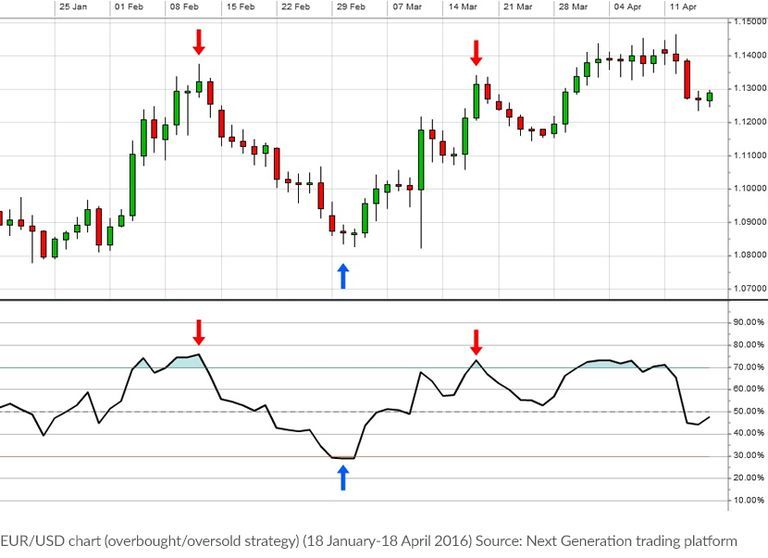
The forex trading strategies mentioned so far have been based on chart patterns and the use of support and resistance levels. Our last strategy takes a more mathematical approach, using something called the Relative Strength Index (RSI). This belongs to a family of trading tools known as oscillators – so-called because they oscillate as the markets move. When the RSI is above 70%, the market is thought to be overbought. This means that it could be getting overstretched and some traders will use this as a signal to expect the market to fall back.
Oversold is when the RSI goes below 30%. Traders will be watching closely, expecting any weakness to run out of steam and the market to turn back up and use this as a buy signal. The FX example in this chart highlights some of the buy and sell signals that came from the overbought/oversold strategy on a daily EUR/USD chart.

one of the good strategy bro. thanks for share to us